

Risk Management
Geopolitical Tail Risk Manager
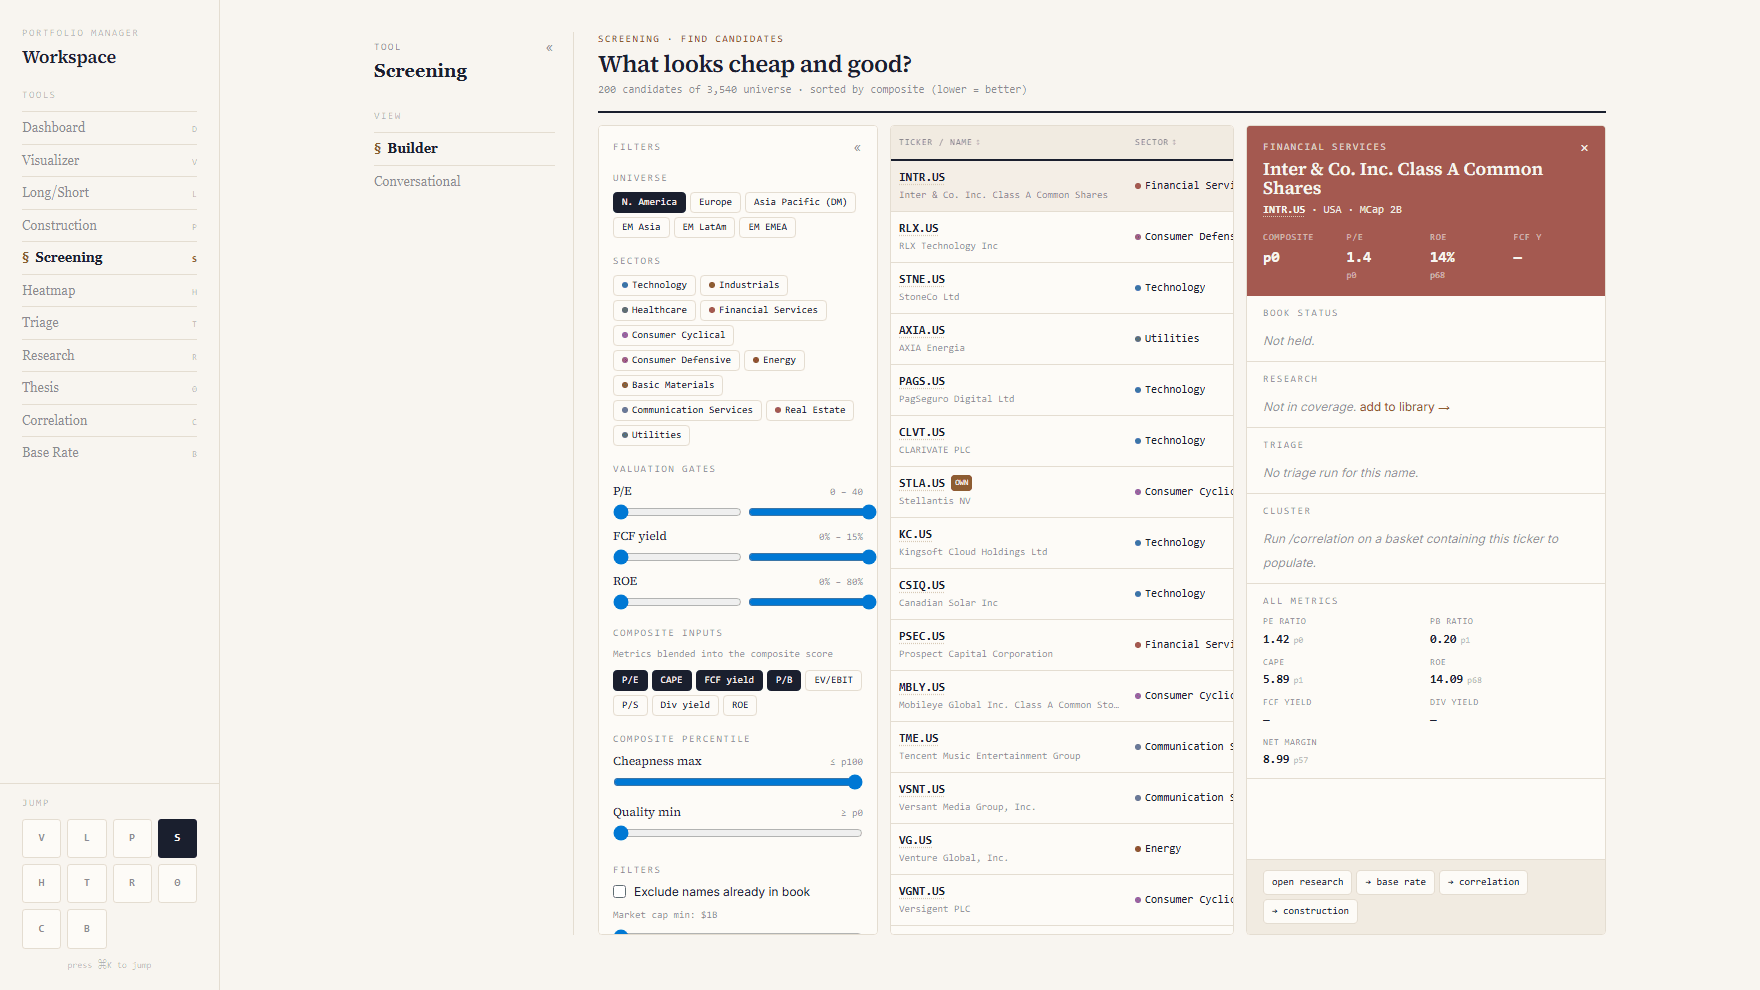
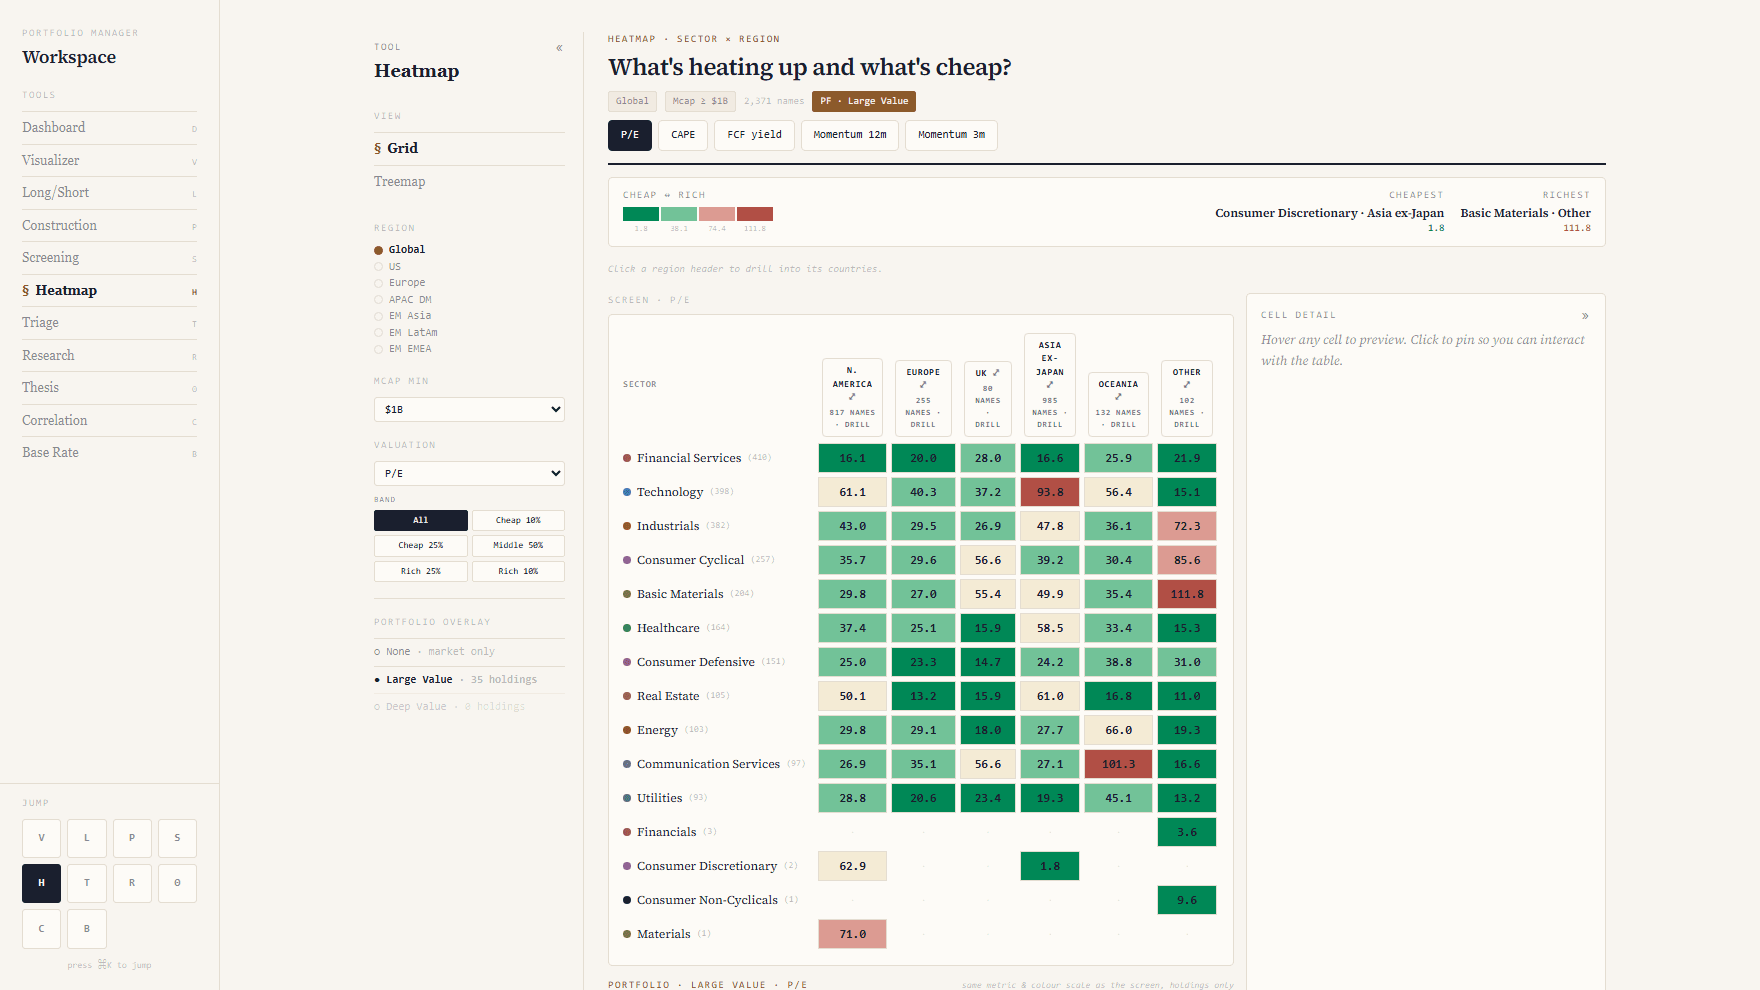
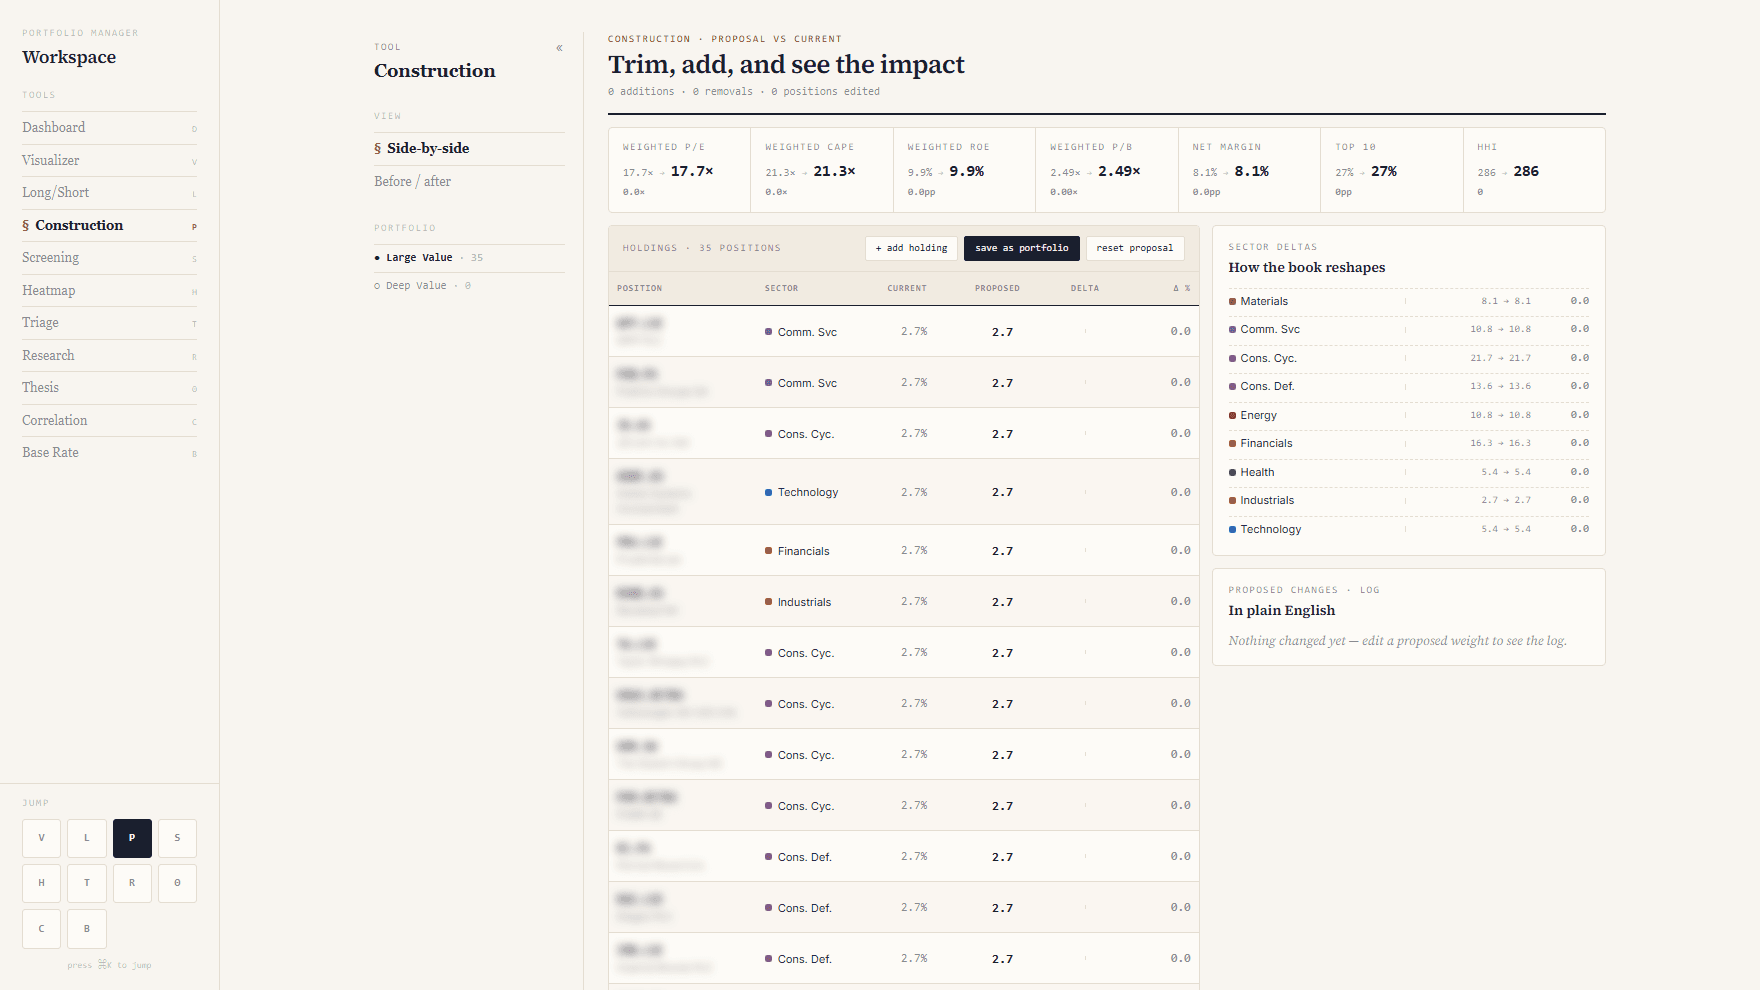
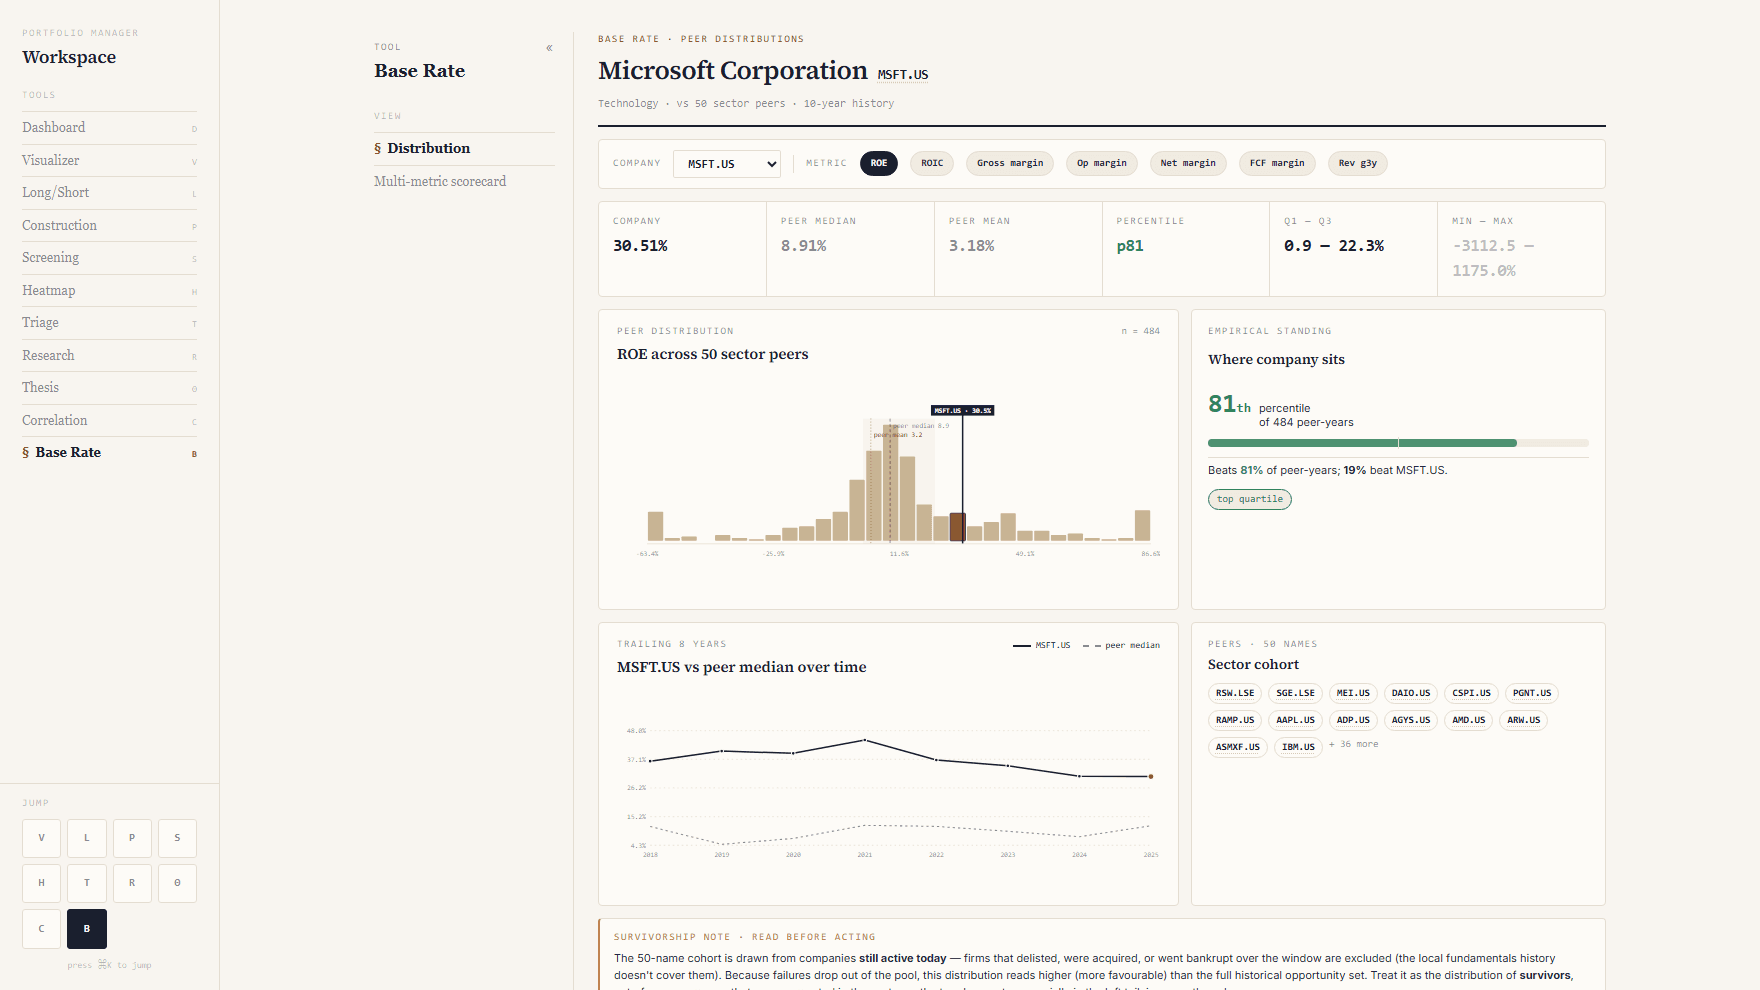
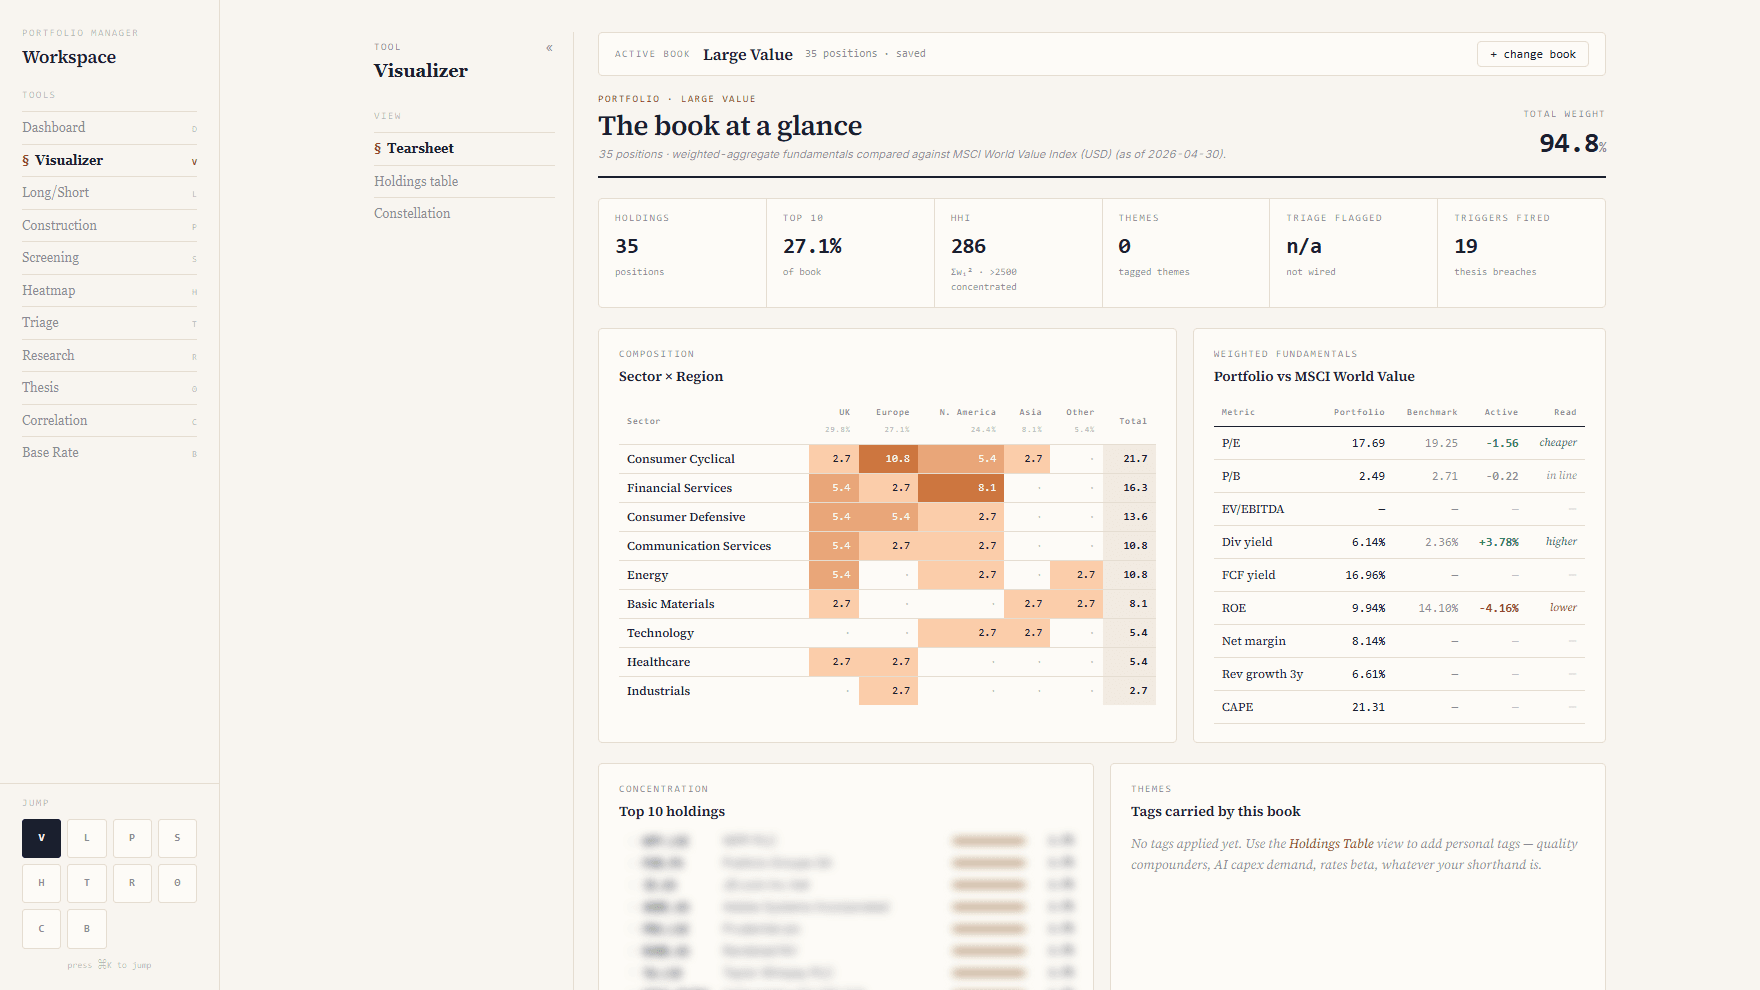
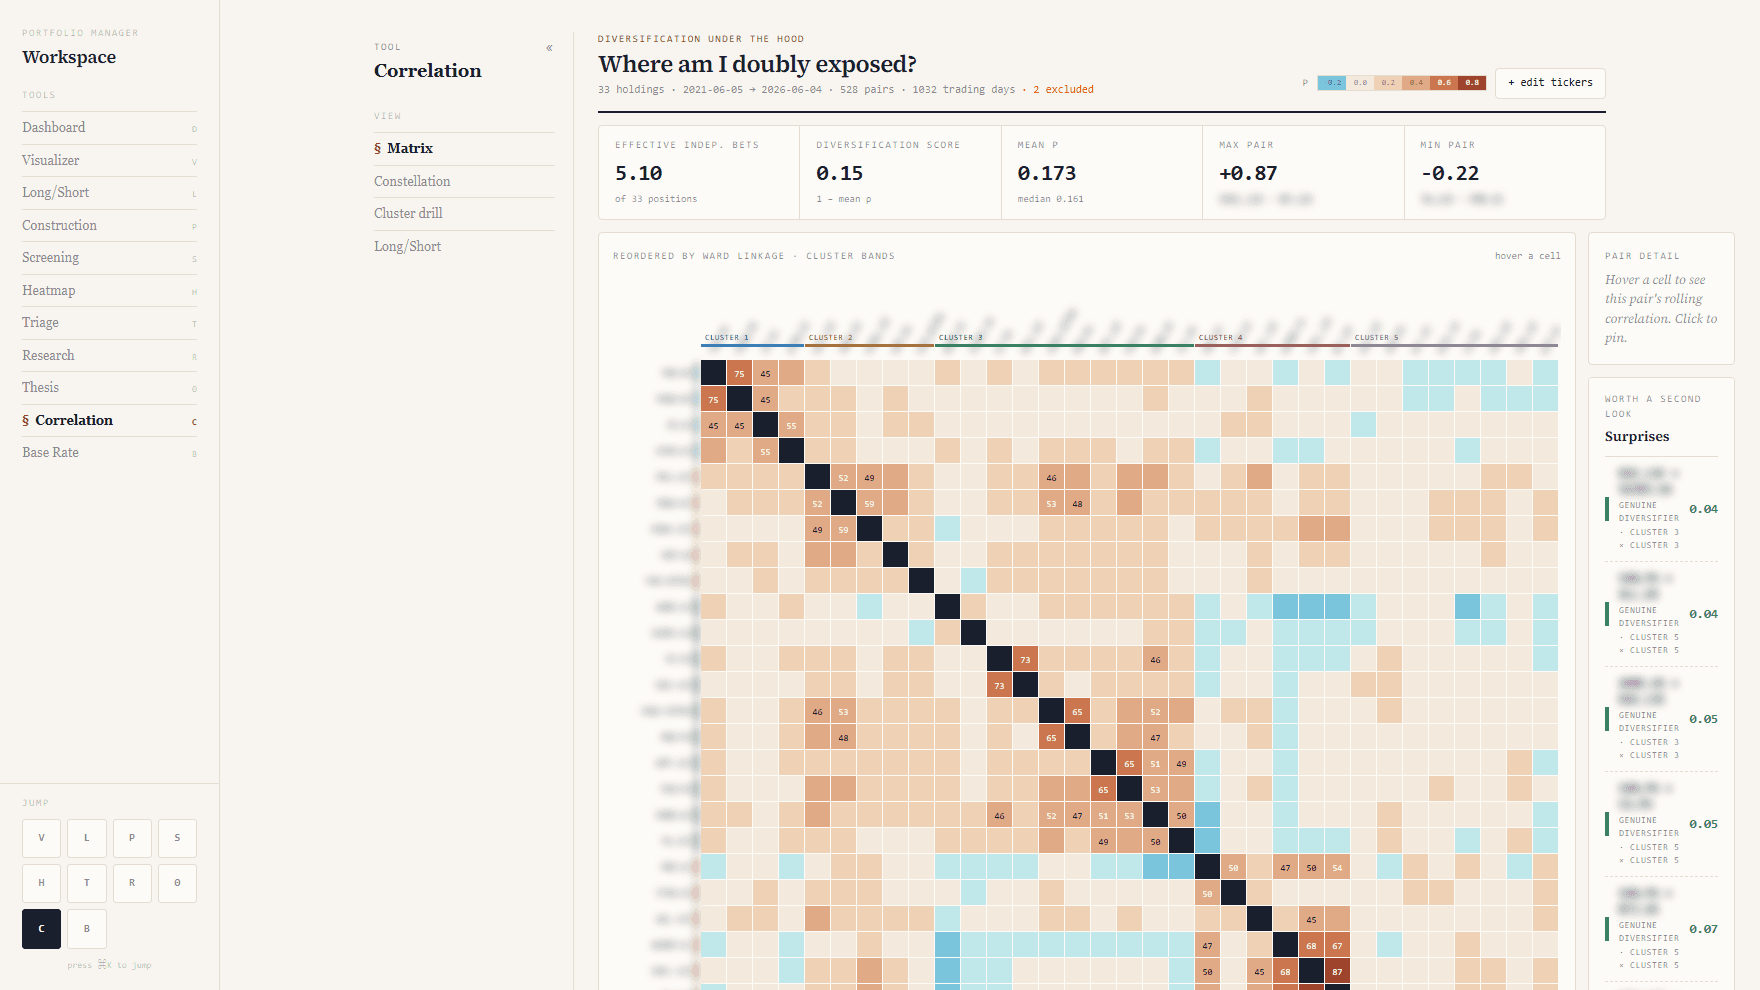
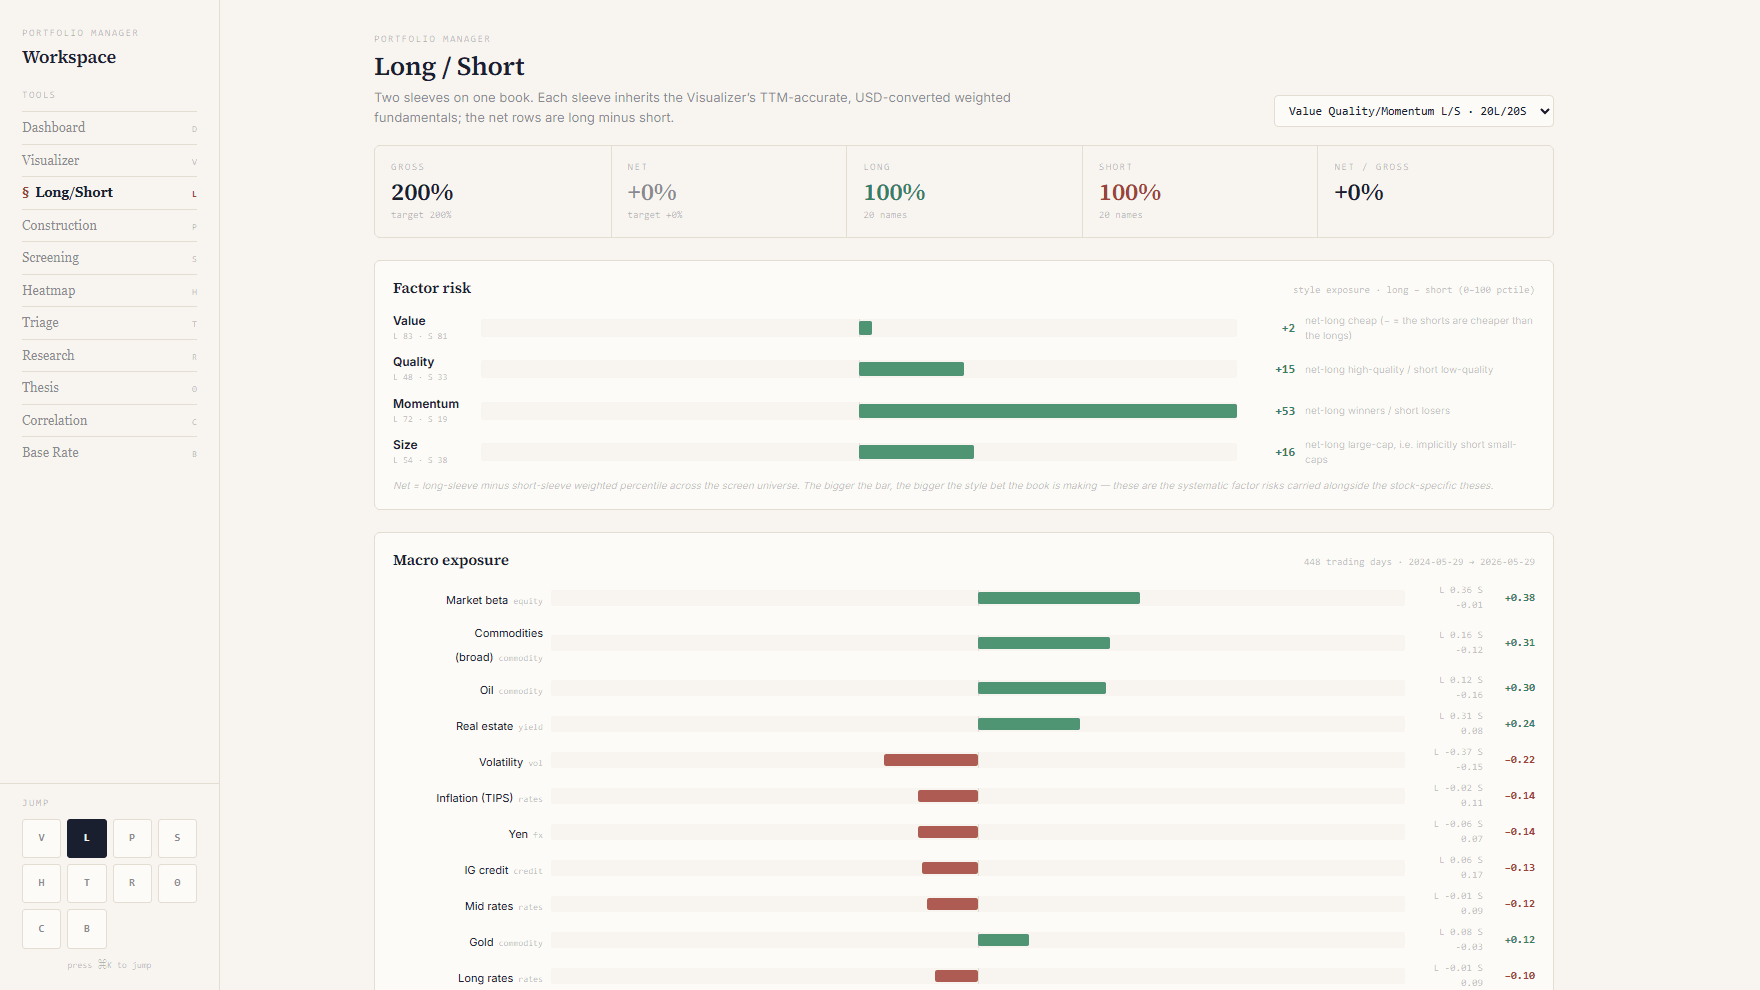
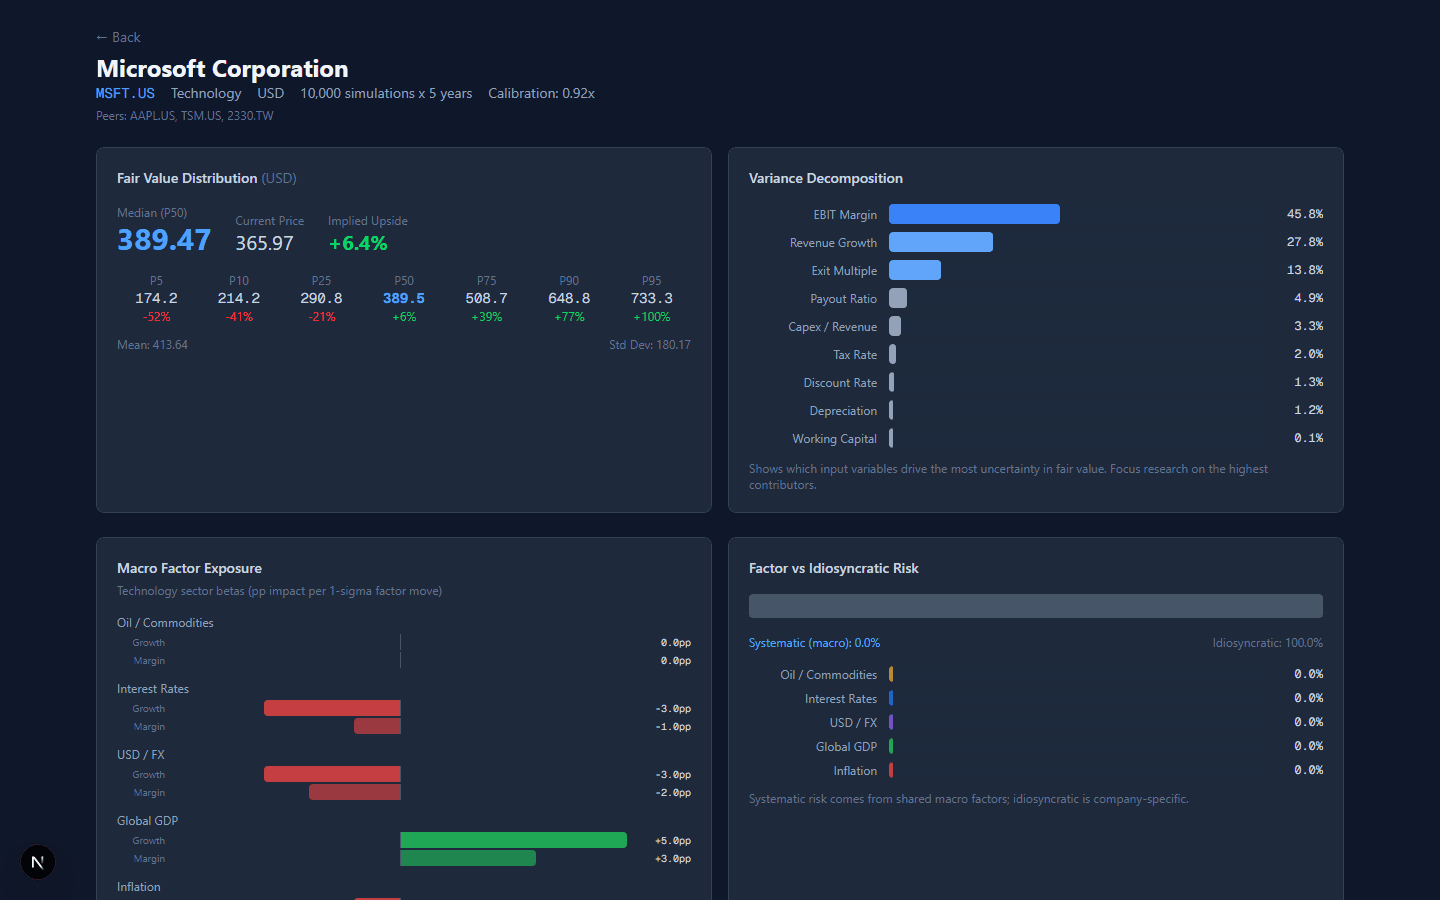
Risk scenario modelling for mapping geopolitical events to portfolio exposures. Probability-weighted impact analysis with tail distribution visualisation and Monte Carlo simulation across multiple risk scenarios.
Next.jsFastAPID3.jsPython